BEGINNERS' GUIDE INTO CRYPTOCURRENCY TECHNICAL ANALYSIS
Technical analysis involves predicting the future of a crypto asset by analyzing its past using charts... technical analysis solely analyzes charts by using indicators to identify patterns that could determine price movement.

Investing in cryptocurrency is quite risky due to the volatility of the crypto market. Assets swing towards highs and lows severally, and a trader/investor who fails to understand to analyze past trends to predict the future of each asset may lose their capital. As a result, crypto traders venture into market analysis.
Market analysis is divided into Fundamental and Technical analysis. Every financial instrument involves market analysis, whether stocks, bonds, crypto, or forex, due to their levels of volatility. The crypto market is arguably more volatile than each of the other financial markets; hence, it is direly important to have a strategy to guide your trading.
What is Technical Analysis?
Technical analysis involves predicting the future of a crypto asset by analyzing its past using charts. Unlike Fundamental analysis, which involves using the news, events, and available information about a coin to make a calculated prediction, technical analysis solely analyzes charts by using indicators to identify patterns that could determine price movement.
Technical analysis is usually referred to as “lagging” analysis because it solely relies on historical trends to predict the future of a coin; this contrasts with fundamental analysis, which relies on present information about the crypto asset to make a calculated guess.
Elements of Technical Analysis
Candlesticks:
A candlestick is the most basic element of technical analysis. A candlestick contains information about an asset’s price activity within a specific timeframe. A chart's timeframe can be set to create new candlesticks per second, minute, hour, day, week, or month.
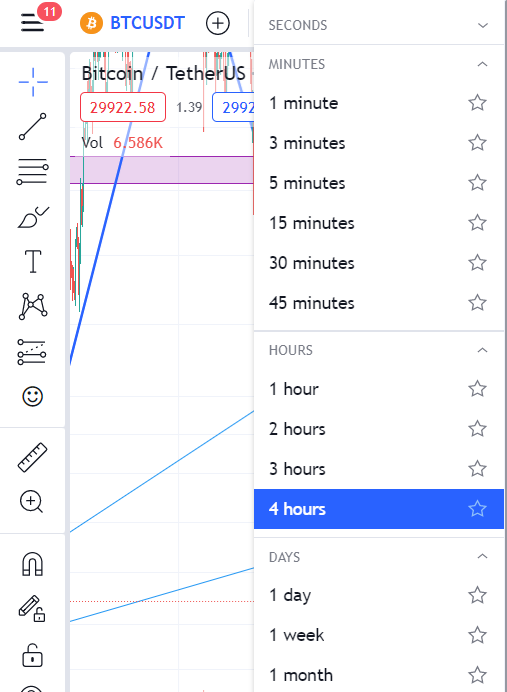
A candlestick can either be green or red. A green candle indicates a positive price movement, while a red candle indicates a negative price movement.

For example, if a chart is set to update every 4 hours, each candlestick will contain information about the asset’s price action within the 4-hour time frame.
The most basic information told by a candlestick includes:
- The opening price: The open price of an asset is its price at the beginning of a specified timeframe. In a green candle, the open price is at the base of the candle’s body, while it is usually on the top of a red candle’s body.
- The closing price: The closing price of an asset is its price at the end of a specified timeframe. In a green candle, the closing price is at the top of the candle’s body, while it is at the base of a red candle’s body.
- The upper wick: The upper wick in a candlestick is the highest price attained during a particular timeframe. For example, if coin X opens at $5 and goes as high as $5.5 before eventually closing at $5.3, the upper wick will be marked as $5.5
- The lower wick: The lower wick in a candlestick is the lowest price attained in a specified timeframe.
Sometimes, a candle stick may have no wick. This occurs when the price of an asset closes at the opening/closing price. For example, if a coin opens at $5 and closes at $5.5 without going above $5.5, there will be no upper wick. Similarly, if a coin opens at $5 and closes at $4.5 without going below $4.5, there will be no lower wick.
What are Candlestick Patterns?
More than just providing information about price action, candlesticks could suggest market biases about a trend change in the market. Candlestick patterns are unique price movements that suggest a specific market movement.
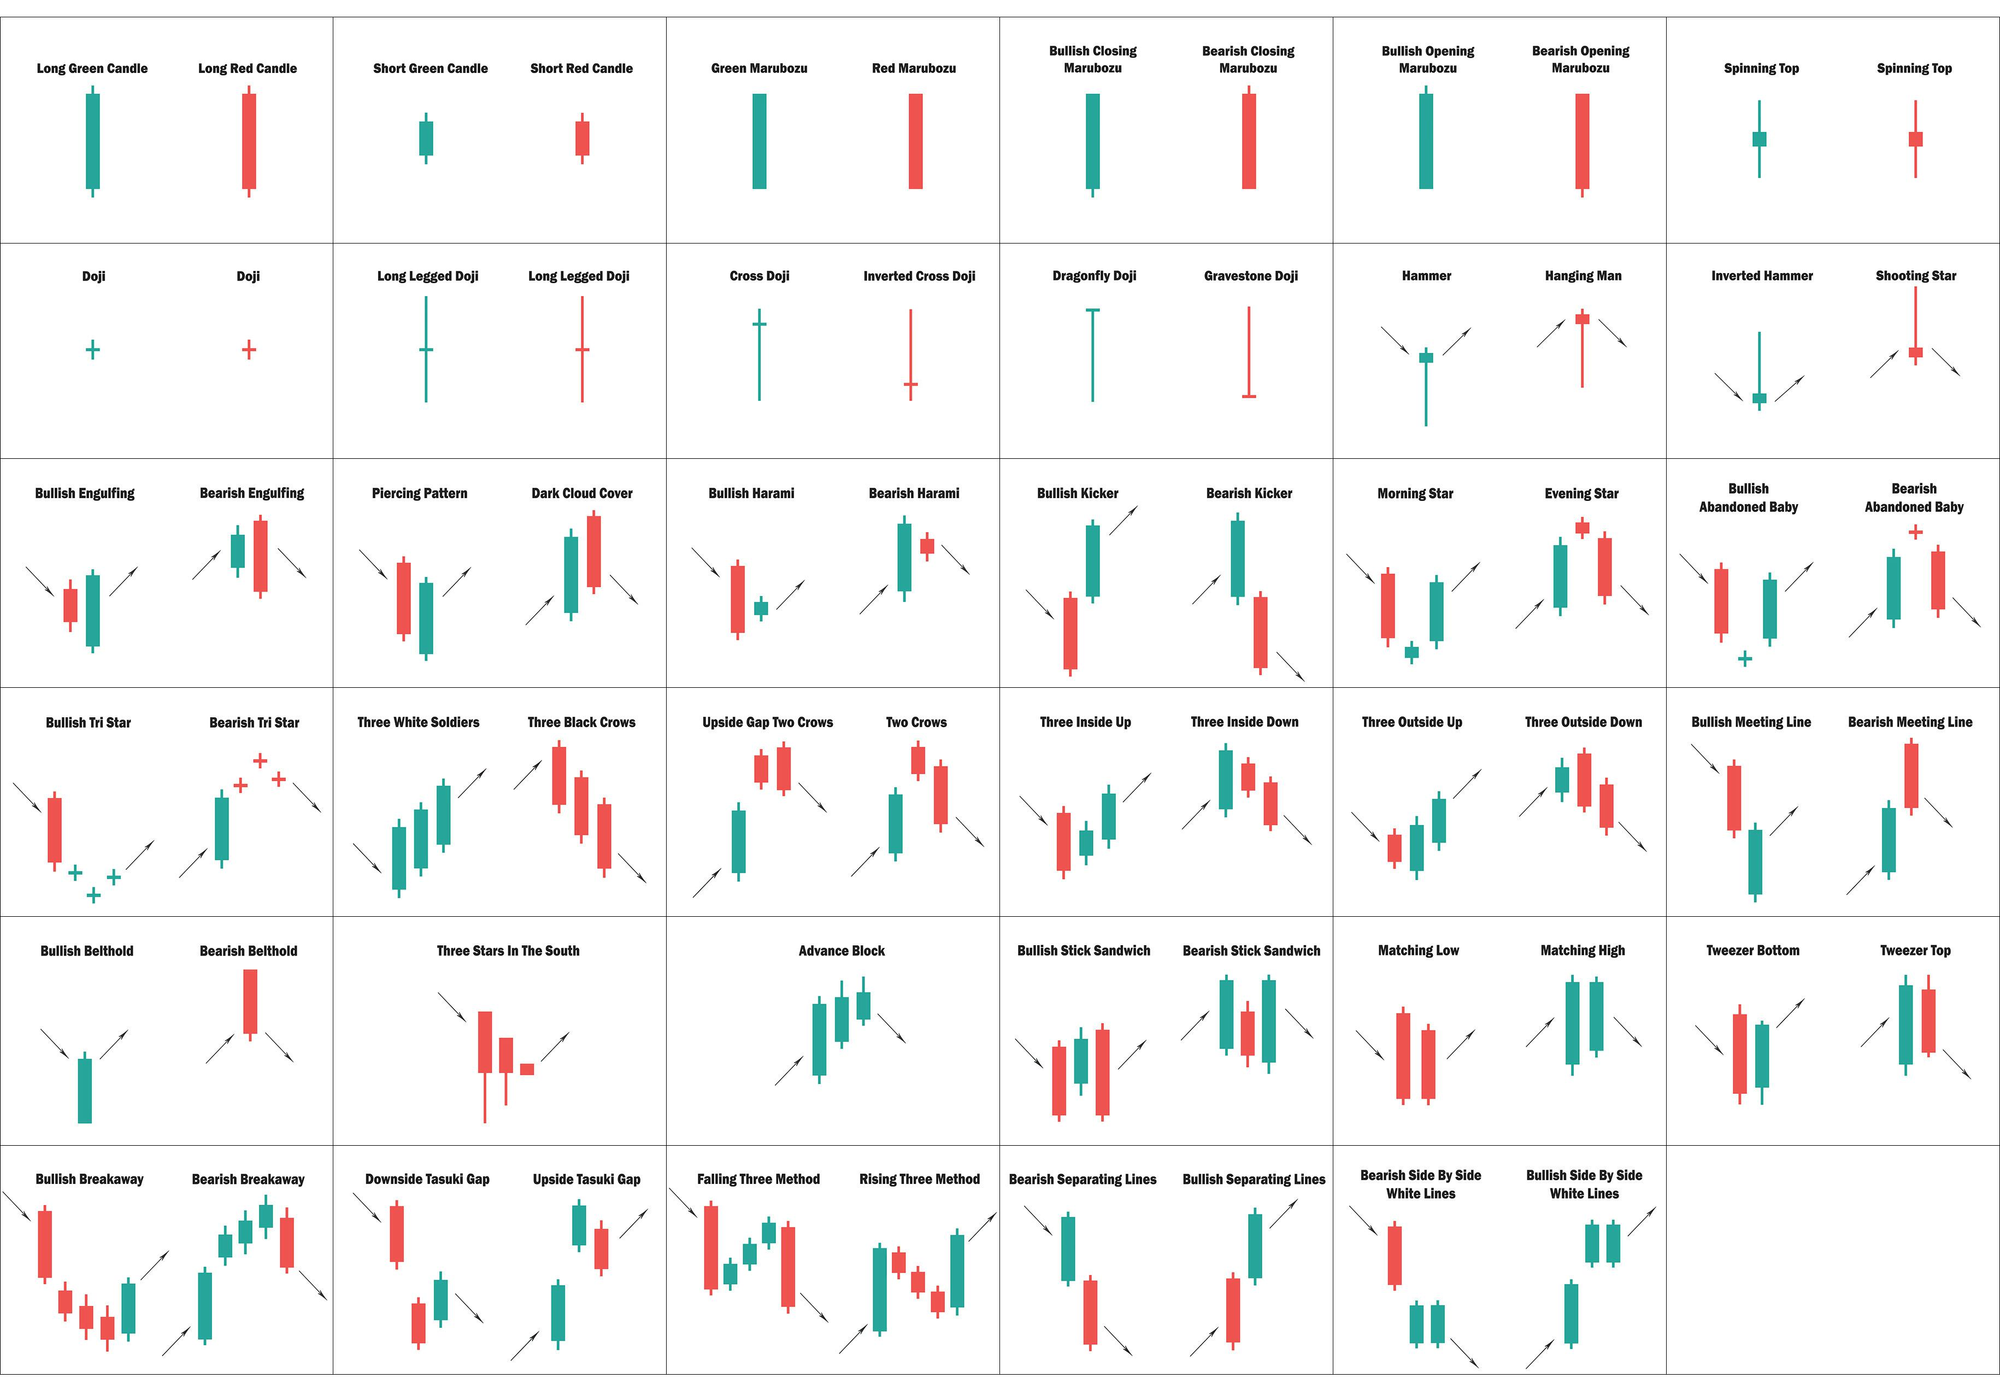
Some candlestick patterns include Dojis, Hammers, Hanging man, Belt-hold, Shooting star, Morning star, etc.
Trading Volumes
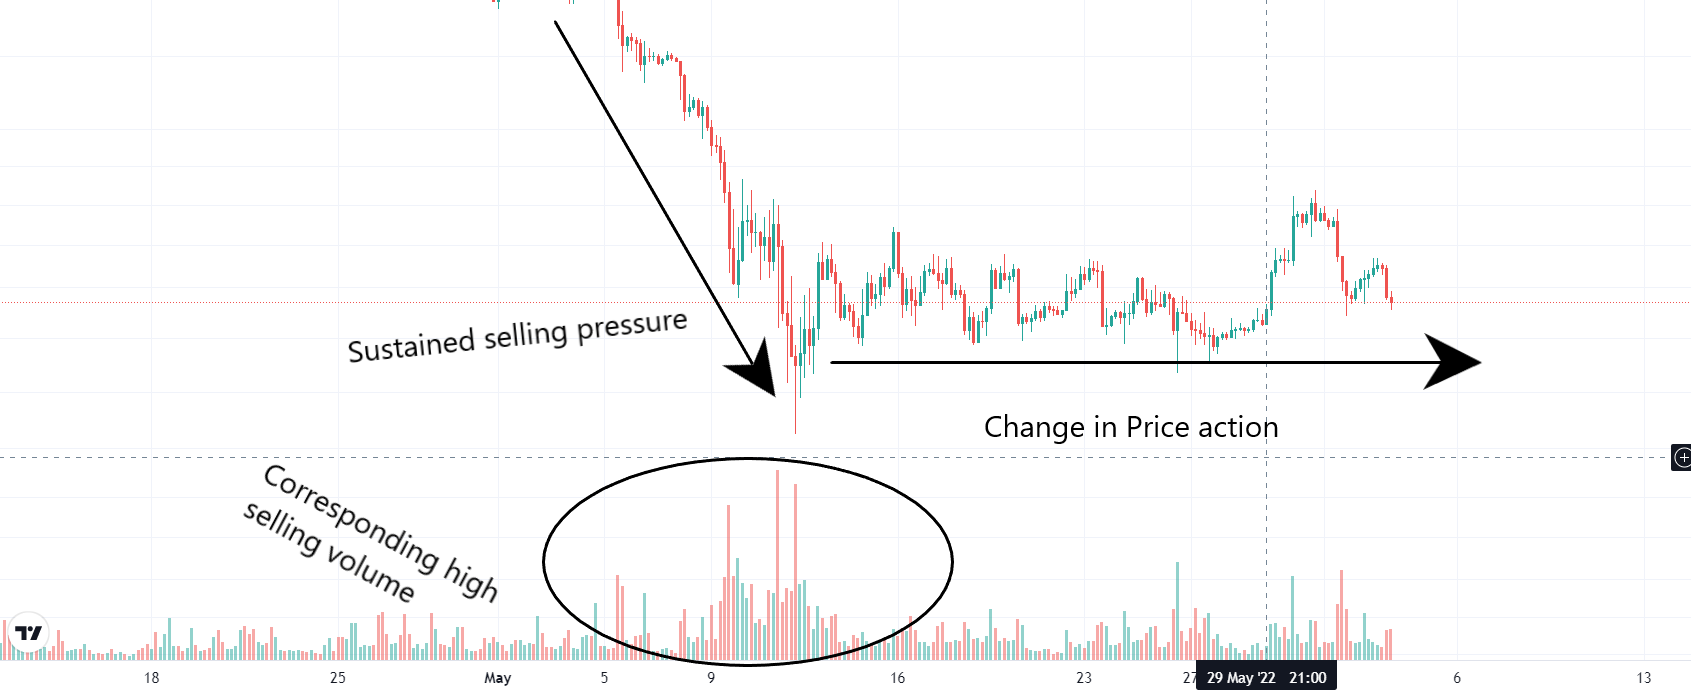
Trading volume in a chart can provide much information to a technical analyst. Usually located below the candlesticks, they provide information on trading volume. An extremely high trading volume indicates massive market activity.
A series of high selling volumes can indicate that the market supply will be exhausted, and the price action will not go further down. Similarly, a series of high buying volumes can indicate that the market demand will soon be exhausted, and the price action will not significantly soar higher.
Support and Resistance
“Support and Resistance” are essential analytical tools on charts. They are used to identify demand and supply points for a crypto asset.
An asset is said to be at a support level if its price falls to a historical level where selling pressure is weak; hence, demand increases and the price is expected to go higher. On the other hand, a resistance level signifies a ceiling where buying pressure is historically exhausted, leading to reduced demand; hence, the price is expected to fall due to excess supply.
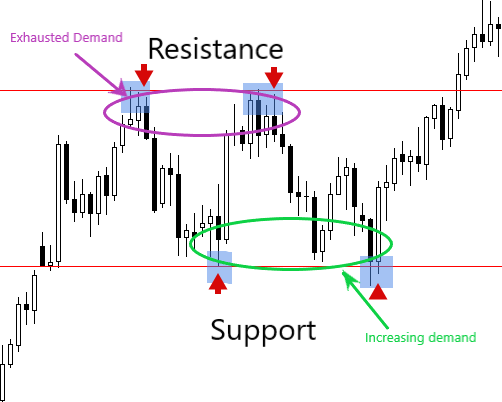
Typically, investors look to buy assets when they reach a support zone and sell when it reaches a resistance zone.
Support and Resistance Flips
In some cases, where supply massively outweighs demand in the support zones, the support zone will be invalidated, and the support zone flips to become a resistance zone. Similarly, when demand outweighs supply in a resistance zone, the resistance is flipped to become a support zone.
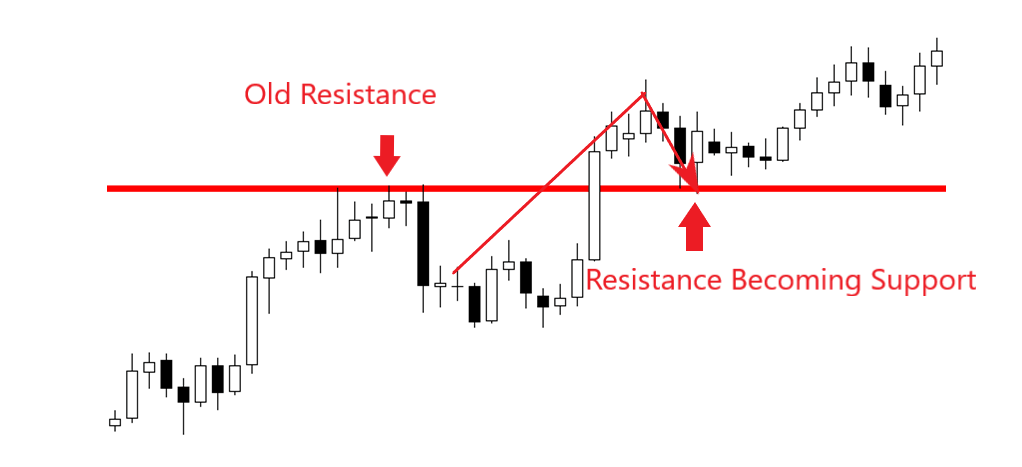
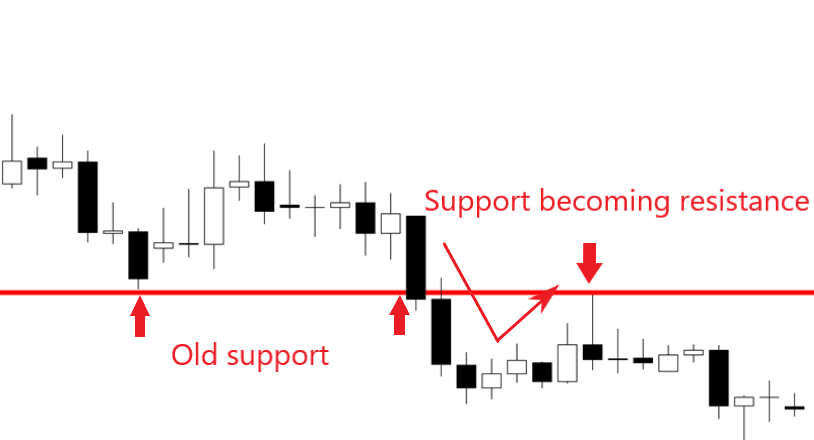
Traders are expected to patiently observe the zones to catch potential flips, which could signify good entry zones for buy/sell trades. “Resistance flipping to support” signifies a good “buy entry,” and “support flipping to resistance” signifies a good “sell entry.”
Trendlines
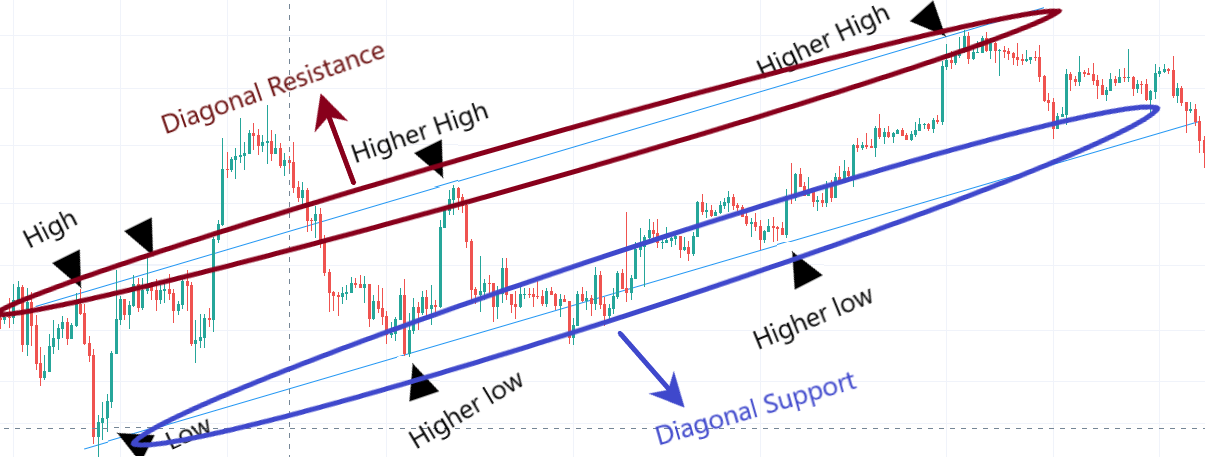
The entire concept of technical analysis is built on the fact that historical trends can give an insight into the future. A trendline is a straight line that connects at least two price points in a diagonal form; it may connect a high price to a higher price or a low price to a lower price. Hence, trendlines connect higher highs and lower lows.

Typically, trendlines are regarded as diagonal support and resistance zones. So, every analysis done with horizontal support and resistance can be replicated in the diagonal version.
Trendlines can also be used in conjunction with
Indicators
Indicators are mathematical tools that help in technical analysis by making historical computations for future predictions by analyzing statistics gathered from price movement, trading volume, and other market activity.
Indicators are divided into four types, namely: trend indicators, momentum indicators, volatility indicators, and volume indicators.
Some commonly used indicators include Relative Strength Index (RSI), Moving averages, Bollinger bands, and Moving Average Convergence Divergence (MACD).
Chart Patterns
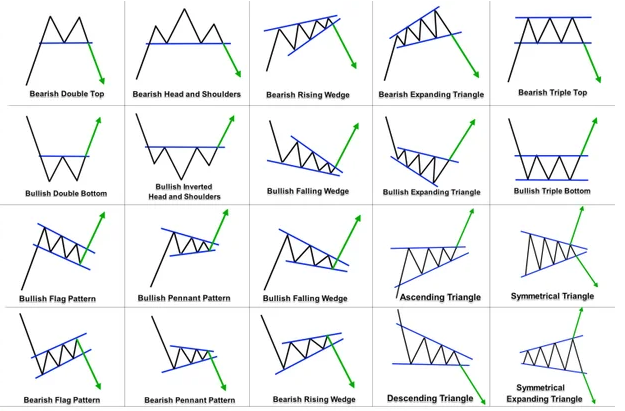
Like candlestick patterns, chart patterns are technical analysis tools used to identify historical market trends and predict the future. However, unlike candlestick patterns, chart patterns are not limited to a few candlesticks; instead, they account for a wide range of candlesticks, trendlines, as well as support and resistance zones as visible on the chart.
Some examples include: head and shoulder, cup and handle, double top, double bottom, wedge, ascending triangle, descending triangle, etc.
In Conclusion
Technical analysis offers traders and investors great insight into the crypto market, helping them enter trades at points where the market is poised to go in their favor. In truth, financial markets move in trends, and history often repeats itself; however, as a trader, you shouldn’t solely rely on technical analysis when trading; instead, combining it with fundamental analysis is better.
Basically, fundamental analysis helps traders get real-time information that could cause swift twists and turns in an asset’s price action, so you can combine this information with the technical analysis to provide you with the best entry and exit points.
Finally, ensure to visit the CCTIP Blog for more detailed guides on cryptocurrency and blockchain technology. Also, follow our social media communities: